5 Jun 2020
S&P 500 Price Analysis: US stocks surge to highest since late February
- The S&P 500 is breaking to 3.5-month highs.
- The level to beat for buyers is the 3267 resistance.
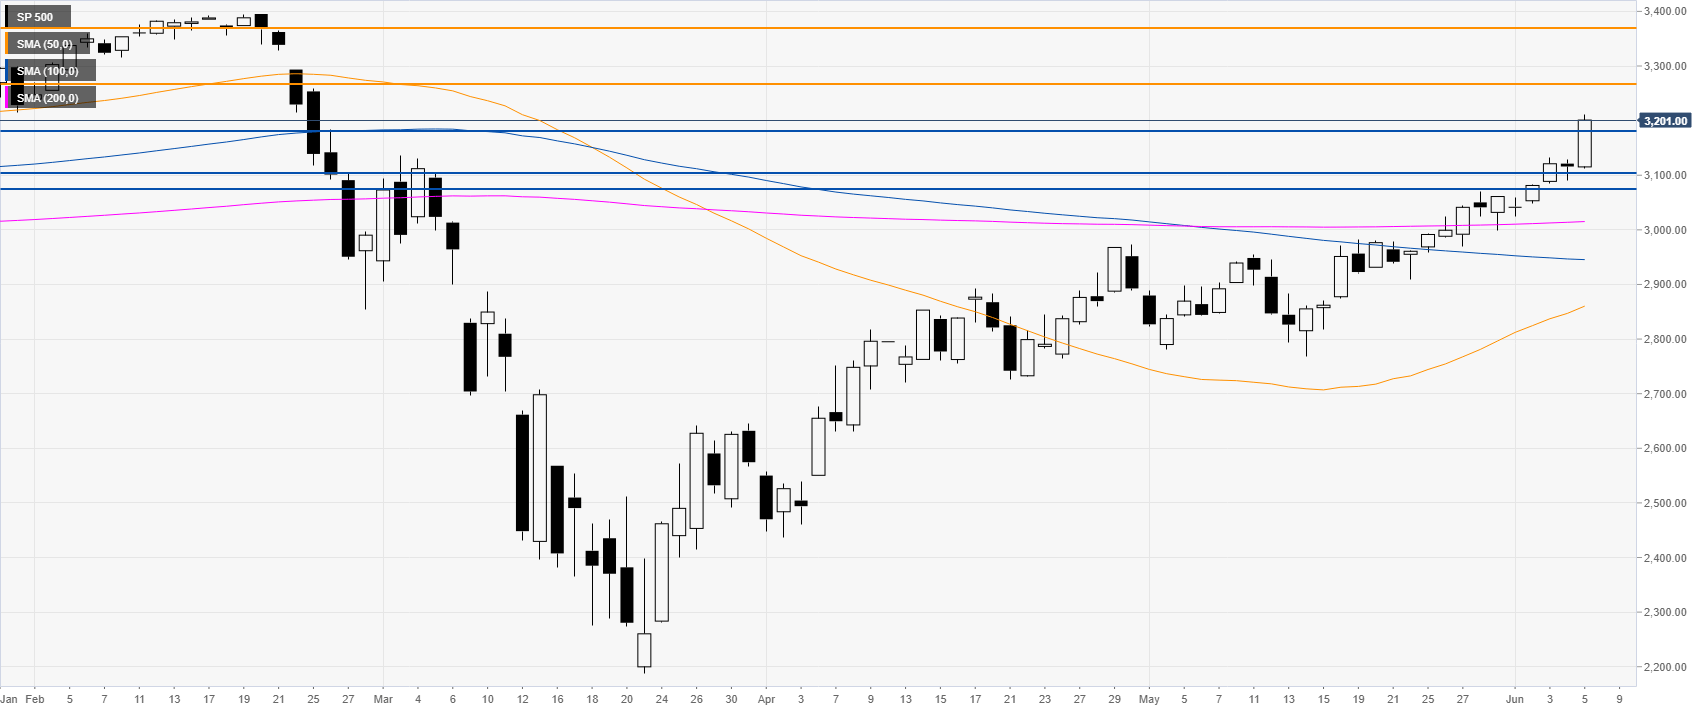
S&P 500 daily chart
The S&P 500 is accelerating to fresh 3.5-month highs as the bulls remain in control. The market is erasing the corona crash as economies are reopening. The break above the 3180 resistance is introducing scope for a run towards the 3267 and 3369 levels in the medium-term. On the other hand, support can emerge near the 3180 and 3100/75 levels initially.
Additional key levels