13 Nov 2018
EUR/USD Technical Analysis: The pair’s bearish stance now looks to 1.1188
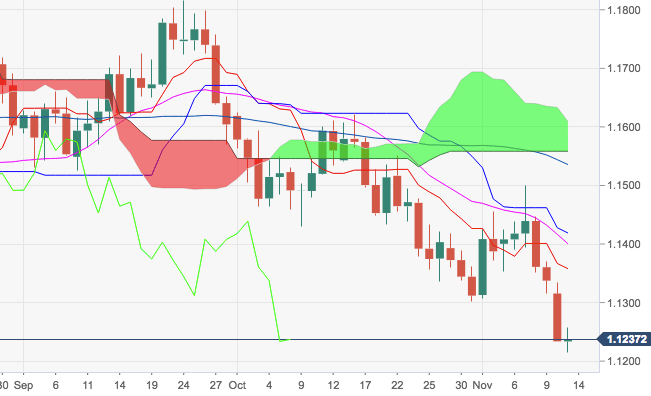
- EUR/USD quickly broke below the 1.1300 handle at the beginning of the week and recorded fresh 2018 lows at 1.1216.
- The breach of 1.1300 is deemed as quite relevant and has now opened the door for a potential visit to 1.1188, the Fibo retracement of the 2017-2018 drop.
- The pair remains under pressure for the time being, while occasional bullish attempts should meet interim resistance at 1.1353 (10-day SMA) ahead of 1.1400 (21-day SMA).
EUR/USD daily chart
EUR/USD
Overview:
Last Price: 1.1231
Daily change: -3.0 pips
Daily change: -0.0267%
Daily Open: 1.1234
Trends:
Daily SMA20: 1.1408
Daily SMA50: 1.1532
Daily SMA100: 1.1574
Daily SMA200: 1.1835
Levels:
Daily High: 1.1334
Daily Low: 1.1234
Weekly High: 1.15
Weekly Low: 1.1316
Monthly High: 1.1625
Monthly Low: 1.1302
Daily Fibonacci 38.2%: 1.1272
Daily Fibonacci 61.8%: 1.1295
Daily Pivot Point S1: 1.12
Daily Pivot Point S2: 1.1167
Daily Pivot Point S3: 1.11
Daily Pivot Point R1: 1.13
Daily Pivot Point R2: 1.1367
Daily Pivot Point R3: 1.14